The impact of urban rail transit on rail ridership and car usage
Using the Circle Line as an exogenous intervention, Dai et al. (2020) isolate and quantify the impact of the transit line on commuting behaviour.
14 July 2022

Rail infrastructure in built-up areas is often a precursor to an increased usage of urban rail transit. Many researchers, for example, have found that living close to rail transit encourages a modal shift from private cars to public transport.
While it might seem intuitive that the new infrastructure caused increased ridership, human behaviour in dense urban areas is, however, an interplay of many factors which may confound this otherwise straightforward relationship.
Have demographics changed across neighbourhoods in response to the new urban transit system? Perhaps the transit facilities had simply increased the demand for commuting – people who might otherwise be at home are now going out more often.
In their paper “Effects of Rail Transit on Individual Travel Mode Share: A Two-Dimensional-Propensity-Score-Matching Approach”, Dai, Diao, and Sing (2020) utilise a repeated cross-sectional survey approach supplemented by 2-dimensional propensity score matching to address inadequacies in previous methodologies. This study attempts to isolate the impact of Singapore’s Circle Line (CCL) on rail ridership and how it also affects other modes of transport such as private cars and buses.
History of CCL and other MRT lines
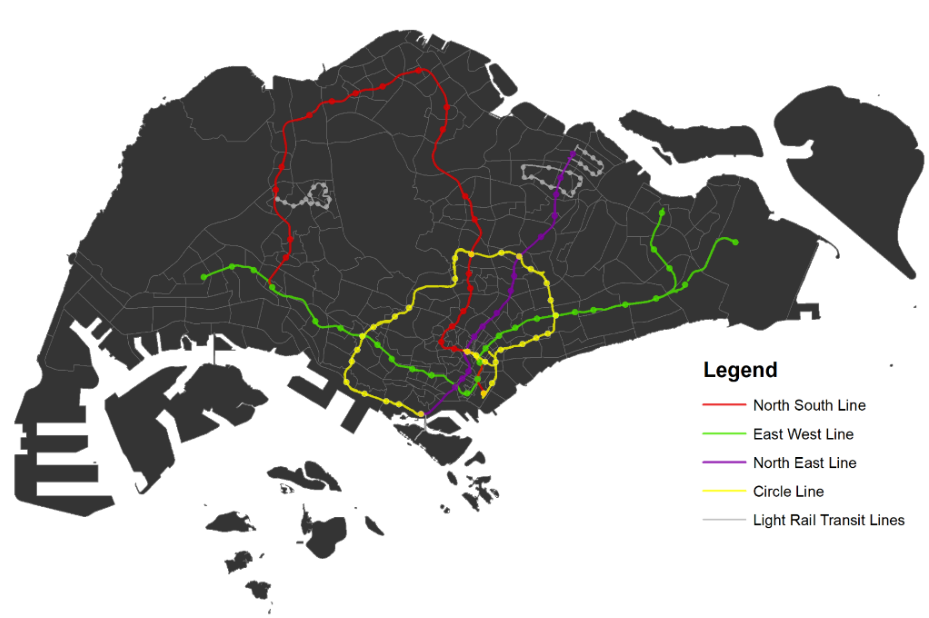
Opened in multiple stages from 2009 to 2011, the Circle Line (CCL) is the fourth MRT line in Singapore after the North-South Line, the East-West Line and the North-East Line, respectively opened in November 1987, December 1987 and June 2003. The CCL spans 35.7 km across 30 stations. It is designed to have an orbital circle route, connecting all the radial MRT lines leading to the city center of Singapore (Figure 1).

Figure 1
DID with 2-dimensional propensity score matching
As Dai et al. highlight, a “simple DID model without controlling for the spatial and temporal heterogeneity among observations captures both effects. Ideally, to assess the net treatment effect of the CCL, we would like to compare the behavior of the same group of individuals living in the treatment and control zone before and after the opening of the CCL.”
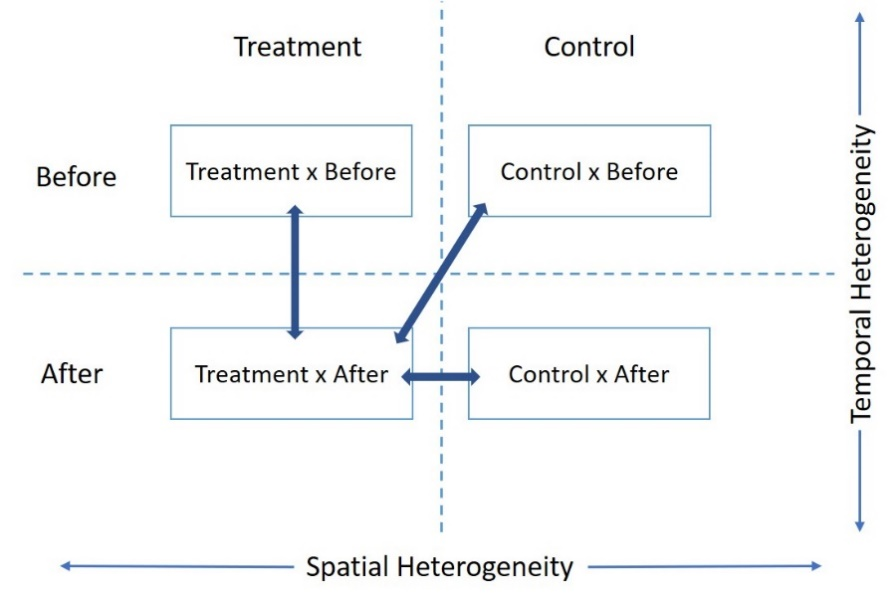
Given that propensity score matching (PSM) is a widely accepted way of controlling for heterogeneity between samples, the researchers deploy a 2-dimensional PSM approach to create matched samples (Figure 2). By matching highly similar individuals across space (treatment vs. control group) and time (e.g., Treatment x Before vs. Treatment x After), the researchers address the problem of spatial and temporal heterogeneity in samples.

Figure 2
Three sets of one-to-one matching are done between the ‘Treatment × After’ group and the other three groups, ‘Treatment × Before’, ‘Control × Before’ and ‘Control × After’. The four groups of matched individuals were then combined into an extensive dataset for DID analysis (see Appendix).
Experimental design
The data for this study come from the 2008 and 2012 Household Interview Travel Surveys (HITS) conducted by Singapore’s Land Transport Authority. The two HITS surveys carried out respectively before and after the opening of the CCL in 2008 and 2012 provide an ideal base from which to investigate the behavioural changes of individuals in response to the new rail transit infrastructure. The two surveys collectively encompass more than 73,000 individuals across more than 20,000 households.
Individuals living within 500 m of a CCL station made up the treatment group, while those living between 500 m and 1,000 m of a CCL station formed the control group.
Findings
As a baseline, regression analysis with unmatched samples (i.e., assuming that populations remain randomised) found that rail mode share for the treatment group increased by 6.4 percentage points after the CCL, and the car mode share decreased by 6.7 percentage points. The results were statistically significant at the 1% level. The share of bus ridership showed no significant change.
The total number of trips generated did not change significantly after the CCL, which indicated that the transit line did not raise the overall volume of commuting. The increase in rail ridership occurred in tandem with a corresponding decrease in private car usage – and given that the total volume of commuting remained the same, the hypothesis that some car users switched over to rail transit after the launch of the CCL receives corroboration.
Regression with PSM-matched samples yielded the following results: rail ridership increased by 10.4 percentage points, while car usage dropped by 5.3 percentage points. While rail mode share increased more sharply and the decline in car mode share softened, the same patterns were observed. Similar to the baseline regression, bus ridership showed no significant change.
The general trend of car-to-rail modal shift remained valid after the researchers conducted robustness tests, which included changing the boundary cuts of the treatment areas (e.g. from 500 m to 400 m and 600 m). Again, bus mode share remained unaffected by the CCL.

Contribution to literature and policy implications
Dai et al.’s study presents a new approach to estimating the treatment effect of rail transit lines on individual travel behaviour with repeated cross-sectional surveys. The 2-dimensional PSM approach addresses the methodological challenges of earlier studies in isolating and quantifying the impact of new rail transit facilities on travel behaviour.
Investing in urban rail transit has often been promoted as an effective strategy to meet increasing travel demand. Identifying the source and magnitude of rail transit ridership increase has significant policy implications for sustainable development. Also, it demonstrates that the massive investment in urban rail transit had effectively achieved its intended goals.
Authors:
Fangzhou, Dai is a postdoctoral research fellow at the Department of Real Estate, National University of Singapore.
Mi, Diao is a professor at the College of Architecture and Urban Planning, Tongji University, Shanghai, China.
Tien Foo, Sing is a professor of real estate and director of the Institute of Real Estate and Urban Studies (IREUS) at National University of Singapore.
Appendix: Empirical Methodology
The baseline regression model is as follows:
Y = α + βX + (r x After) + (δ x Treat) + (θ x Treat x After) + ε
Y is the mode share of a certain transport mode, defined as the number of trips made in that mode divided by the total number of trips across all modes. “Treat” and “After” are the dummy variables, which take values of either 0 or 1, respectively depending on whether the sample is in the treatment group or not, and whether it is before or after the CCL.
For example, Treat=1 when the sample is in the treatment group, otherwise Treat=0, in which case Y = α + βX + ε or Y = α + βX + (r x After) + ε depending on whether the control group is before or after intervention. The model for treatment group before intervention is Y = α + βX + (δ x Treat), where (δ x Treat) accounts for existing differences between treatment and control groups prior to intervention.
α is a constant (the value of Y when all explanatory variables are set to 0 i.e. the minimum ridership islandwide) and X is a set of control variables (e.g. household size, dwelling type, gender, monthly income and other socioeconomic variables). The coefficient β measures rail ridership as X varies for different values of socioeconomic variables.
The researchers calibrated 3 regression models for rail transit, car, and bus, respectively.
Illustration (samples randomised through PSM):
(Treatment × After) vs (Treatment x Before)
i.e. Y1 = α + βX + (r x After) + (δ x Treat) + (θ x Treat x After) + ε vs Y2 = α + βX + (δ x Treat) + ε
Y1 – Y2 = (r x After) + (θ x Treat x After)
The difference of Y1 and Y2 is the increase in rail ridership in the treatment group after intervention. (r x After) measures change in rail ridership in the control group after intervention. Since samples have been randomised through PSM, (r x After) can be interpreted as the overall increase in ridership islandwide, likely due to greater overall rail transit connectivity brought about by the CCL. Summary statistics in the study show that ridership in the control group increased by about 8.6% after CCL. After factoring out (r x After), (θ x Treat x After) is isolated as the variable that accounts for the impact of CCL on ridership in the treatment group.

