Will we still get to enjoy hawker fare 10 years down the line?
Hawker culture in Singapore scored a resounding goal when it gained official recognition by UNESCO in 2020. But amid a challenging landscape, will this time-honoured trade survive despite the prestigious accolade?
Wong Wei Chen
30 October 2023

To many Singaporeans, hawker centres are a vital “third place” where people from all walks of life can gather to dine and bond over delectable ethnic fare that is highly affordable.
Tracing their origins to the diverse food cultures of different immigrant groups who settled in Singapore, they have, over the years, evolved into distinctive local dishes that form an important part of our food heritage.
This unique combination of food, placemaking and community is today an integral part of Singaporeans’ way of life, and hawker culture was successfully inscribed as Singapore's first element on the UNESCO Representative List of the Intangible Cultural Heritage of Humanity on 16 Dec 2020.
Challenges for hawker culture
According to Ivan Png, “the inscription gave international recognition to the key role of hawker food in Singapore society in the past and present” and is also “important as an economical source of sustenance for all Singaporeans”.
Ivan Png is a Distinguished Professor in the School of Business and Departments of Economics and Information Systems and Analytics (by courtesy) at the National University of Singapore.
Prof Png, however, also highlights that the life of a typical food hawker is taxing. Long hours in a congested space, together with a relatively low income, presents a double whammy for those contemplating this trade.
In his working paper, he also notes that the average food hawker is 60 years old, and “unless the industry can attract a pipeline of new blood, the future of the industry is concerning”.
Factor in price-sensitive consumers who persistently expect cheap food, and an increasingly affluent population that gravitates towards cafes, restaurants and other high-end F&B establishments, the hawker trade could very well face extinction in the years ahead despite its UNESCO accolade.
The preventive measure of monitoring the ups and downs of this industry for policy intervention, where necessary, is therefore timely, especially since UNESCO requires governments to identify, protect and safeguard intangible cultural heritage practices.

Tracking hawker sentiment
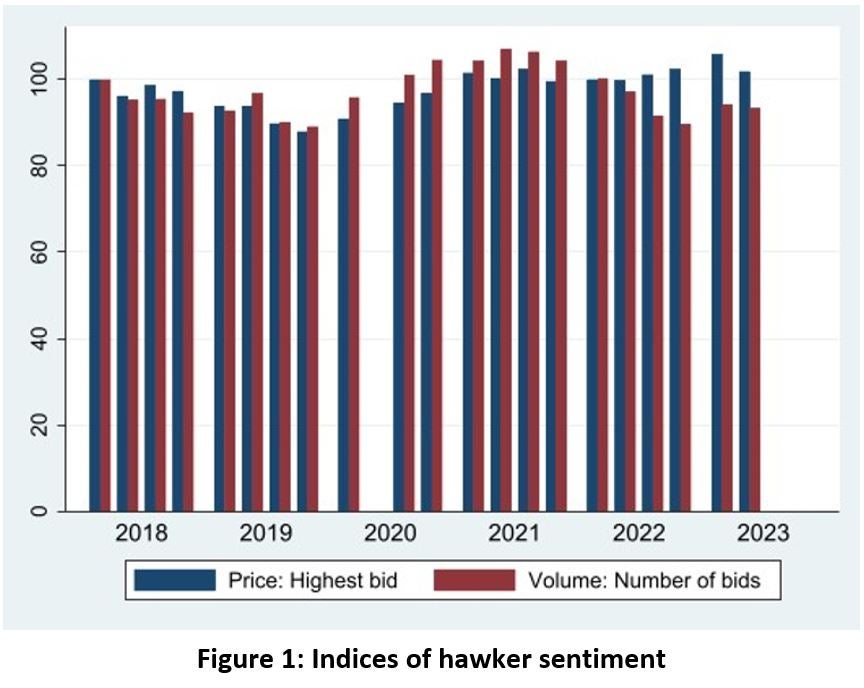
In his working paper, Prof Png constructs two quarterly indices – a price index and a volume index – to jointly measure the sentiment of potential hawkers, and thereby gauge the supply of people keen to join the industry (Figure 1).

Every month, the National Environment Agency (NEA) conducts auctions to rent out vacant hawker stalls, while potential hawkers submit their bids in dollars of monthly rental. Subject to NEA’s approval, vacant stalls will be awarded to the highest bidder.
Post-auction, NEA publishes a schedule of successful tenderers – from which the highest bids for vacant stalls involved in the auction exercise could be observed – and also a “5 Highest Tender Bids” report which serves as an approximate proxy for the number of bids received i.e. bid volume.
With 1Q 2018 as the base period, and prices and bid volume normalised to a basis of 100, Prof Png traces the indices over a period of 22 quarters, up till 2Q 2023.
Observations
Price sentiment declined from the base period, 1Q 2018, and bottomed out in 4Q 2019. Auctions were suspended in 2Q 2020 during which Covid “circuit breaker” measures were in force.
Sentiment as represented by volume then recovered to peak in 2Q 2021, and thereafter went on a downward trajectory. As at 2Q 2023 volume sentiment was 7% lower than in the base period.
Sentiment as represented by price continued to climb to a peak in 1Q 2023. As of 2Q 2023, the price index was similar to that in the base period.
On the whole, since 2Q 2021 (when the number of bids peaked) the volume index and price index appeared to have diverged. The former went south, while the latter alluded to bullish sentiments, and both painted contrasting pictures of the hawker industry – which therefore warranted some technical investigation.

Technical considerations
Rather than taking the simple average of successful bids for every quarter – which would then overlook potential interference from omitted variables – Prof Png deployed ordinary least squares (OLS) multiple regression on successful bids with controls for hawker centres. Controls for product category (cooked food, Halal, Indian, drinks or cut fruit) were not identified as they were collinear with the indicators for hawker centres.
A quarterly price index score thus represented the average price of successful bids for the quarter, but with endogeneity and collinearity minimised, and was therefore a more representative measure of hawker sentiment.
Similarly, OLS multiple regression was performed on bid volume. Prof Png however cautions that NEA reports only the top five bids (in the “5 Highest Tender Bids” report), meaning that for any given stall, any bid beyond the top five were excluded from the report. The regression model would treat the bid volume as 5, whereas in reality, there were more tenders. That affected the accuracy of the volume index, and hence, given current data constraints, Prof Png proposes the price index as a more reliable measure of hawker sentiment for now.
Policy implications
Going forward, more historical data would enable a more accurate assessment of longer-term trends in hawker sentiment, and shed light on the long-term trajectory of the supply of hawker food in Singapore.
Also, as discussed above, current data constraints compromise the accuracy of the volume index, meaning that the price index is now the sole measure of sentiment. Price, however, is not simply a function of demand, but is also influenced by supply as well (i.e. number of stalls available for auction). On its own, the price index may prove insufficient as an adequate measure of hawker sentiment. Hence, further improvement of bidding data, which can raise the accuracy of the volume index, would enable a more reliable assessment. In so far as both corroborate each other, any analysis based on these indices have stronger validity.
It would also be interesting to not just consider hawker sentiment in isolation, but to also compare it against consumption patterns in competing F&B sectors, which may yield more insights. For example, a positive correlation between hawker sentiment and its competitors could indicate macroeconomic influence (e.g. softening economy and wages that depress consumption as a whole), while an inverse correlation might reflect that consumers are moving away from humble hawker fare to more upscale F&B establishments.
Png, Ivan is a Distinguished Professor in the School of Business and Departments of Economics and Information Systems and Analytics (by courtesy) at the National University of Singapore. He is currently a fellow at the Center for Advanced Study in the Behavioral Sciences, Stanford.

