NUS-Wharton-Tsinghua Chinese Residential Land Price Indexes (CRLPI)
Introduction
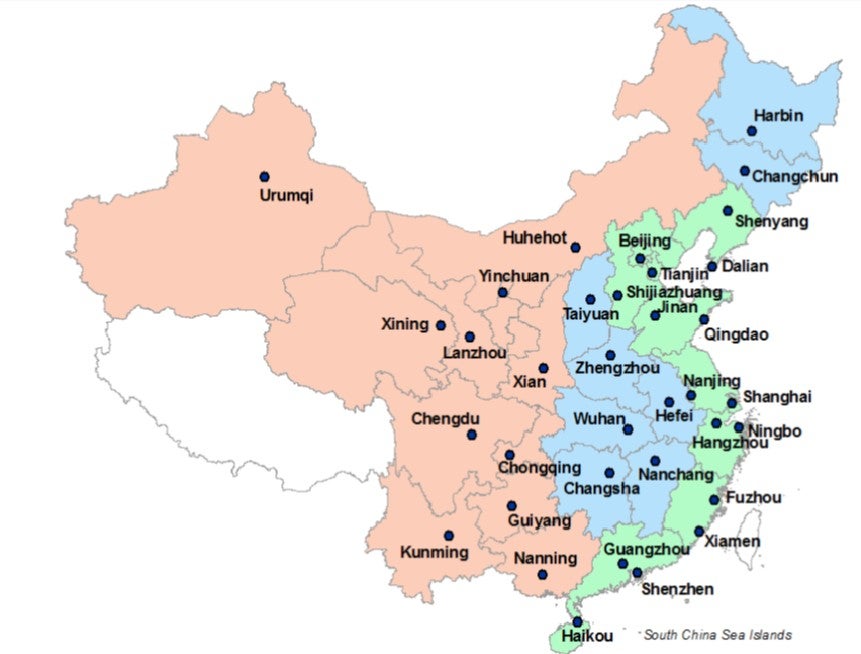
The NUS-Wharton-Tsinghua Chinese Residential Land Price Indexes (CRLPI) are constant-quality series that track changes in the real value of residential land parcels in 35 major cities across China. Index values are reported at quarterly, semi-annual, and annual levels for different levels of geographic aggregation (i.e., national, regional and city) depending upon data availability and quality.
We provide the first multi-city, constant quality land price index for 35 major markets in China. While there is meaningful heterogeneity in land price growth across cities, on average the last nine years have seen land values skyrocket in many markets, not just those on or near the coast. The typical market has experienced double-digit compound average annual growth in real, constant-quality land values. The 2009-2010 stimulus period typically saw large surges in prices. Three notable characteristics about the land value appreciation series are their strong mean reversion at annual frequencies, the strong common factor in their movement, and their very high volatility. Quantities, not just prices, have been sharply increasing in recent years. The typical amount of space supplied via land auctions in our 35 city sample has doubled since 2008.
Market update to the 1st Quarter of 2017
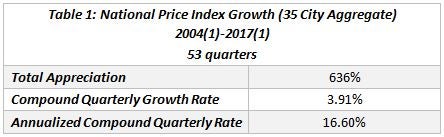
Figure 1's plot of the aggregate index of the 35 cities shows that, following a modest decline in the last quarter of 2016, land price substantially increased by 14.2% in 2017(1). This is the largest sequential quarter-on-quarter growth of the 35-city aggregate index in the start of a new year since the first quarter of 2007. This leaves the CRLPI 36.9% higher than it was one year ago in 2016(1).
Transactions volumes substantially dropped, as Figure 2 documents, with land parcel sales down by 26.7% compared to the previous quarter. However, sales volume still is 1.7% higher than in the same quarter one year ago [2016(1)], and is 35.0% above the 2015(1) number.
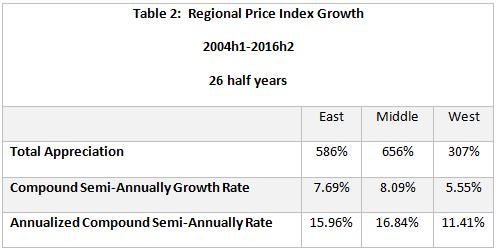
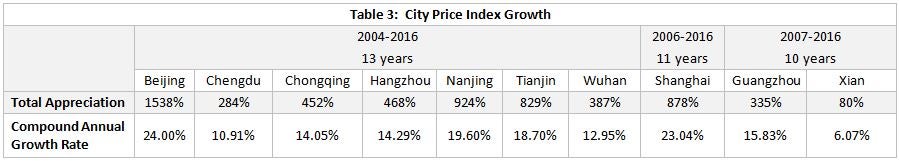
We report land price indexes for the three regions of China on a semi-annual basis, and those for the dozen large cities on an annual basis. Those indexes will be updated later in the year.
Land Market Coverage
CRLPI in Charts
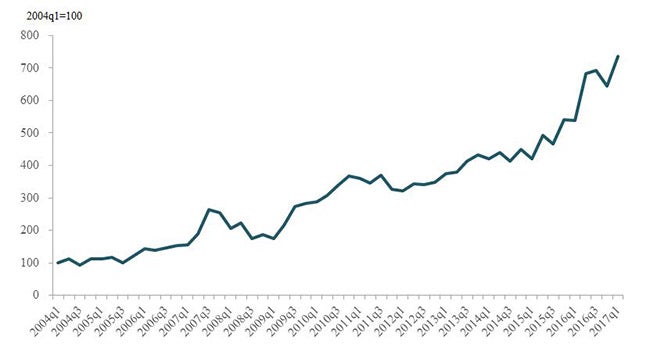
Figure 1: Chinese National Real Land Price Index 35 Markets, Constant Quality Series(Quarterly: 2004q1 – 2017q1)
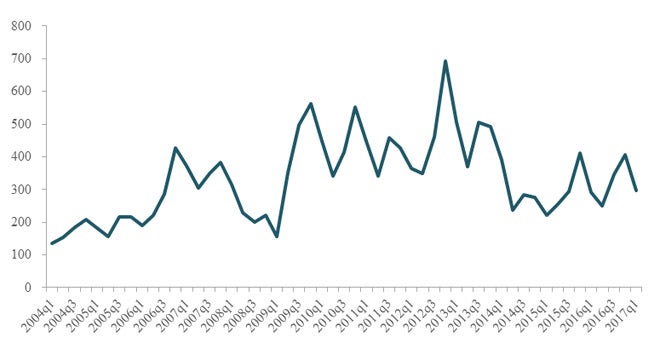
Figure 2: Number of Parcels Sold 35 Markets (Quarterly: 2003q1 – 2017q1)
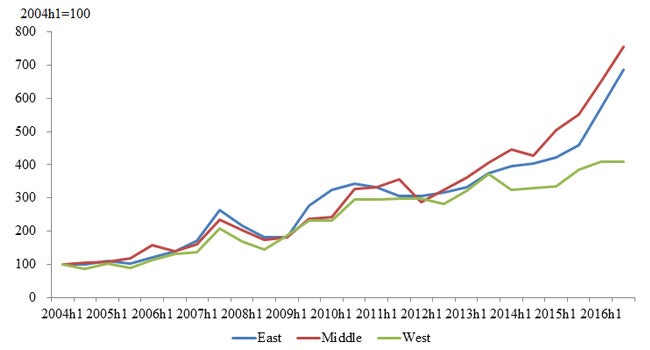
Figure 3: Chinese Regional Real Land Price Index East, Middle and West Regions, Constant Quality Series (Semi-annually: 2004h1 – 2016h2)
Figure 4: City-Level Real Land Price Index, Ten Cities, Constant Quality Series(Annually: 2004 – 2016)
Note: The Compound Quarterly Growth Rate (CQGR) is calculated by the formula CQGR(Ta,Tb)=([V(Tb)/V(Ta)])^(1/(Tb-Ta))-1 where V (Ta) is the starting value, V (Tb) is the finishing value, and Tb-Ta is the number of quarters, with Ta=1 by definition.
Collaborating Parties
- Institute of Real Estate & Urban Studies, National University of Singapore
- The Wharton School, University of Pennsylvania
- Hang Lung Centre for Real Estate, Tsinghua University
Index Methodology
![]() CRLPI White Paper 1st Sept 2014
CRLPI White Paper 1st Sept 2014
News & Media
![]() Press Release
Press Release
![]() 中国日报网房产: “中国主要城市居住用地价格指数”发布
中国日报网房产: “中国主要城市居住用地价格指数”发布
![]() 财新网: 35 个大中城市地价十年间上涨三倍多
财新网: 35 个大中城市地价十年间上涨三倍多
![]() 经济观察网: 2004 年-2014年北京地价与房价均上涨6倍多
经济观察网: 2004 年-2014年北京地价与房价均上涨6倍多
![]() 新华网: 新加坡国立大学房地产研究院院长邓永恒:城镇化需统筹兼顾
新华网: 新加坡国立大学房地产研究院院长邓永恒:城镇化需统筹兼顾
Enquiry Email jesse@nus.edu.sg